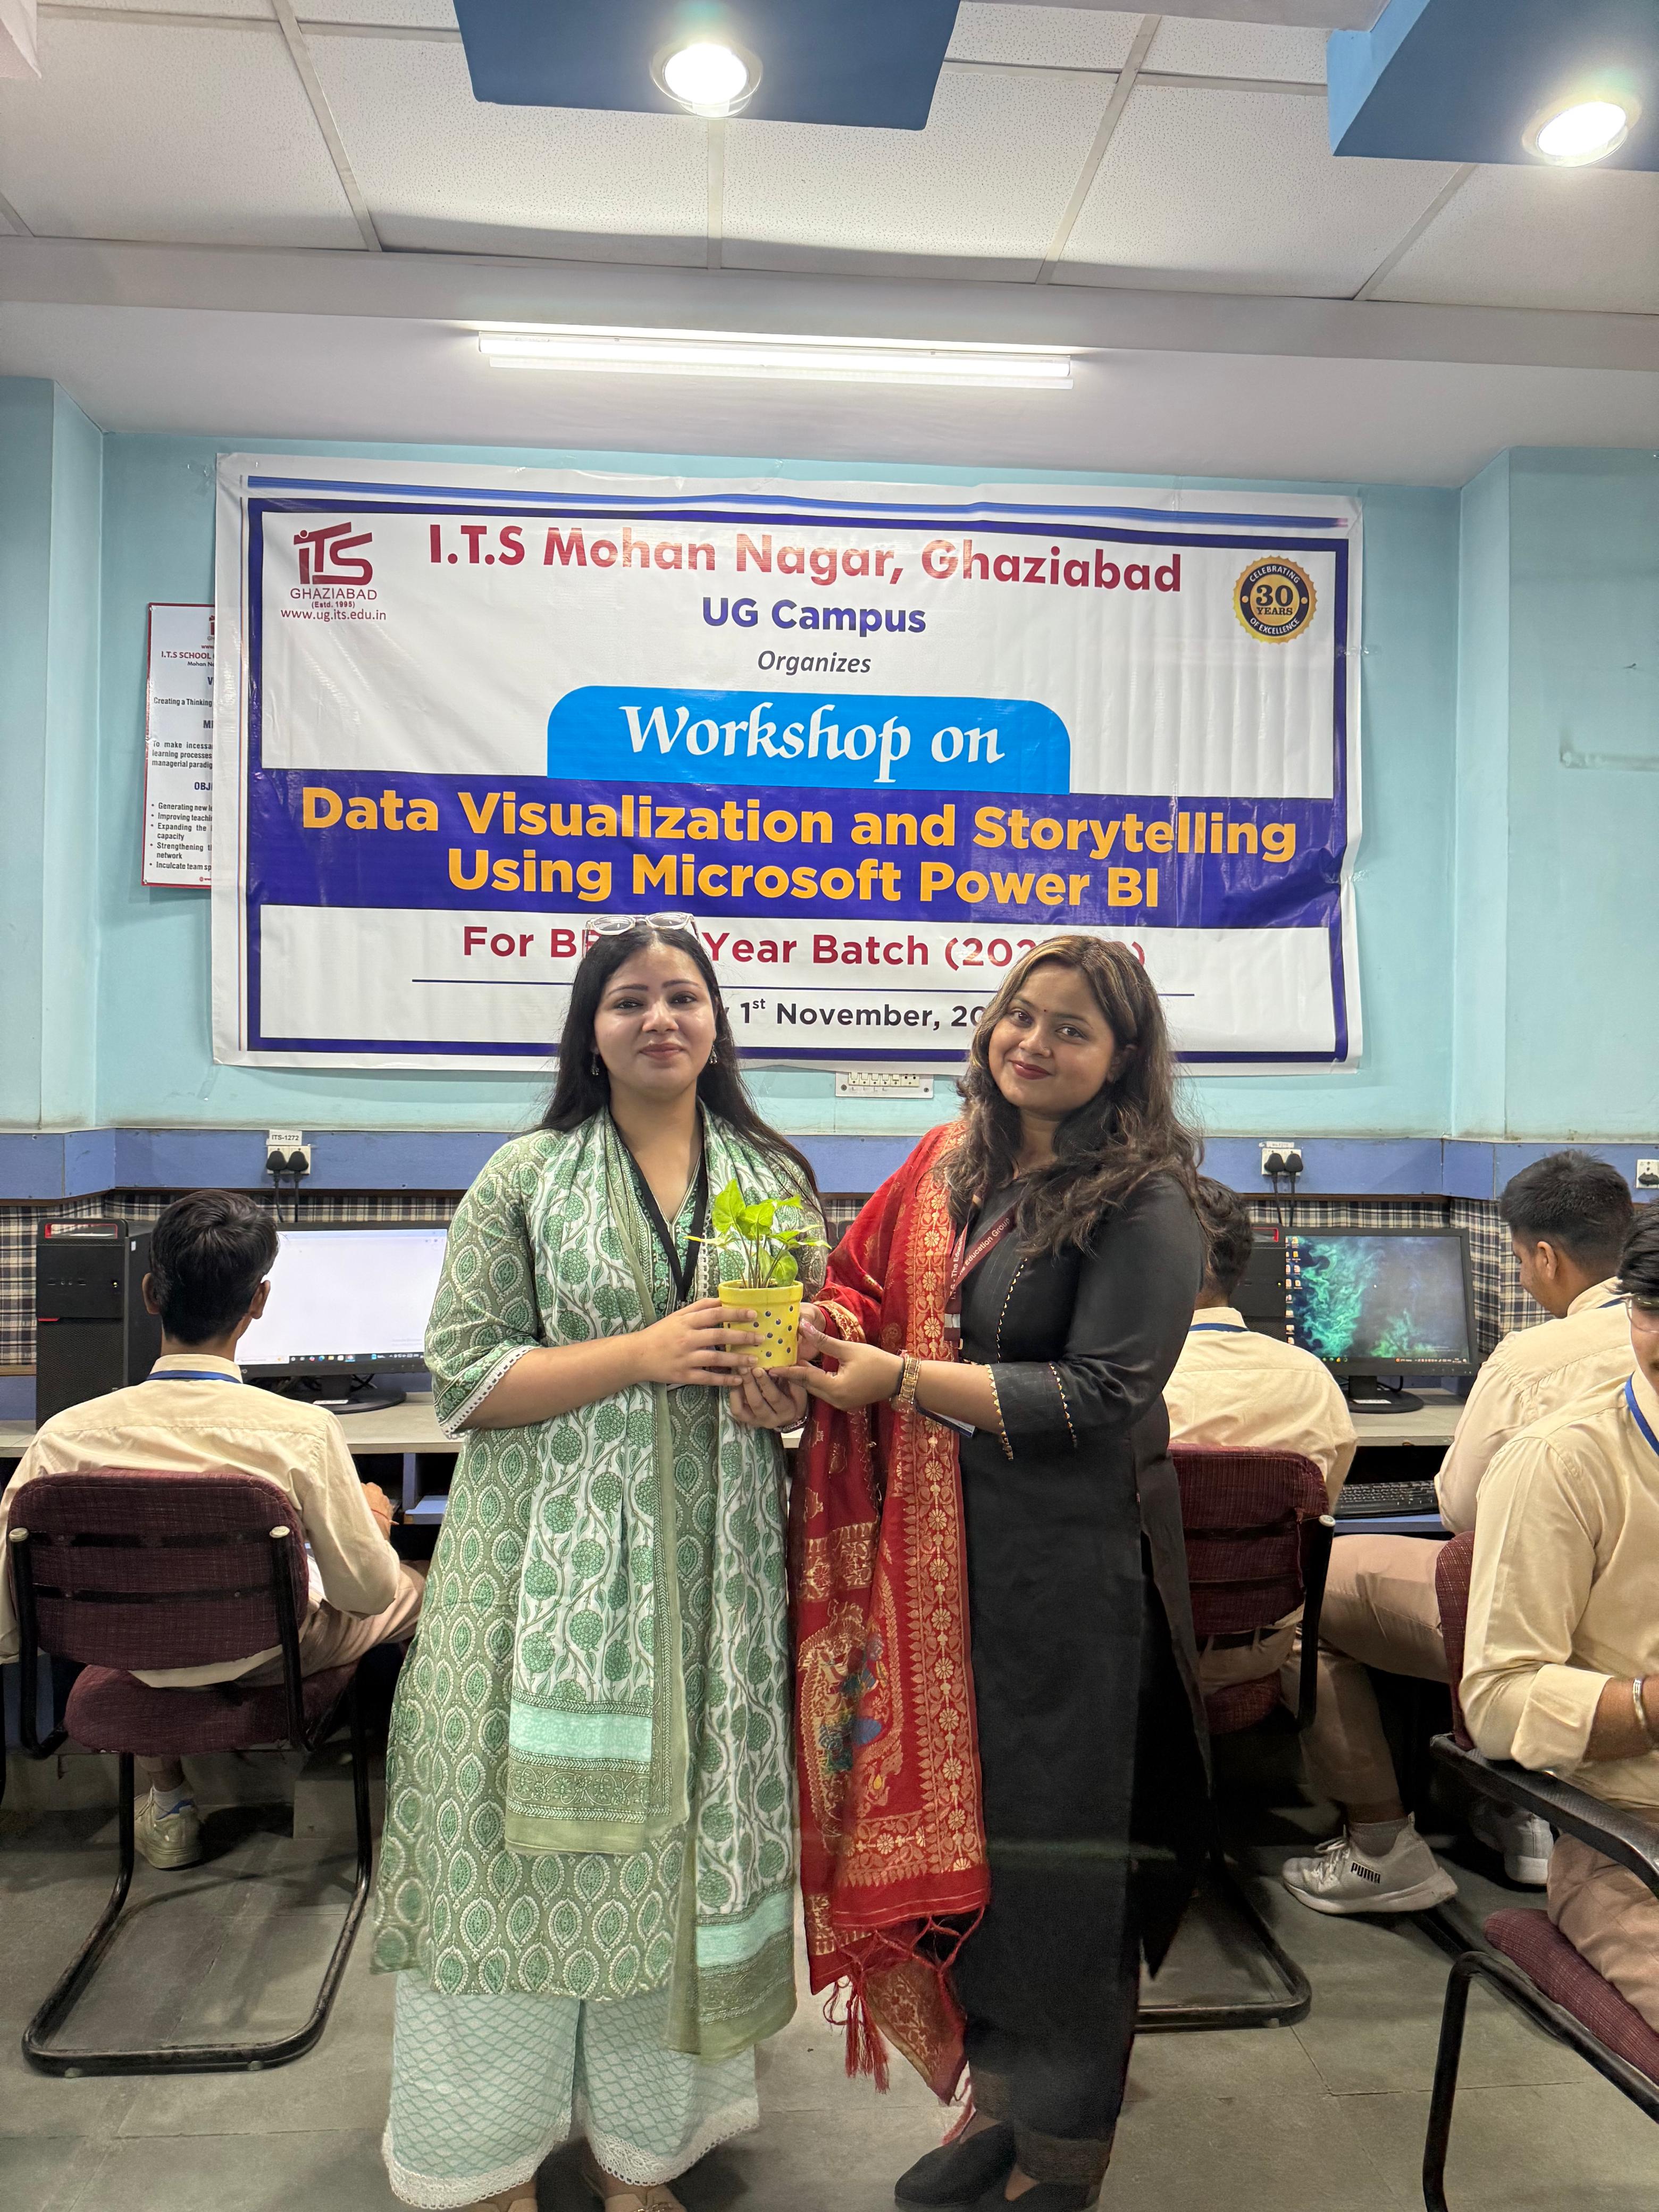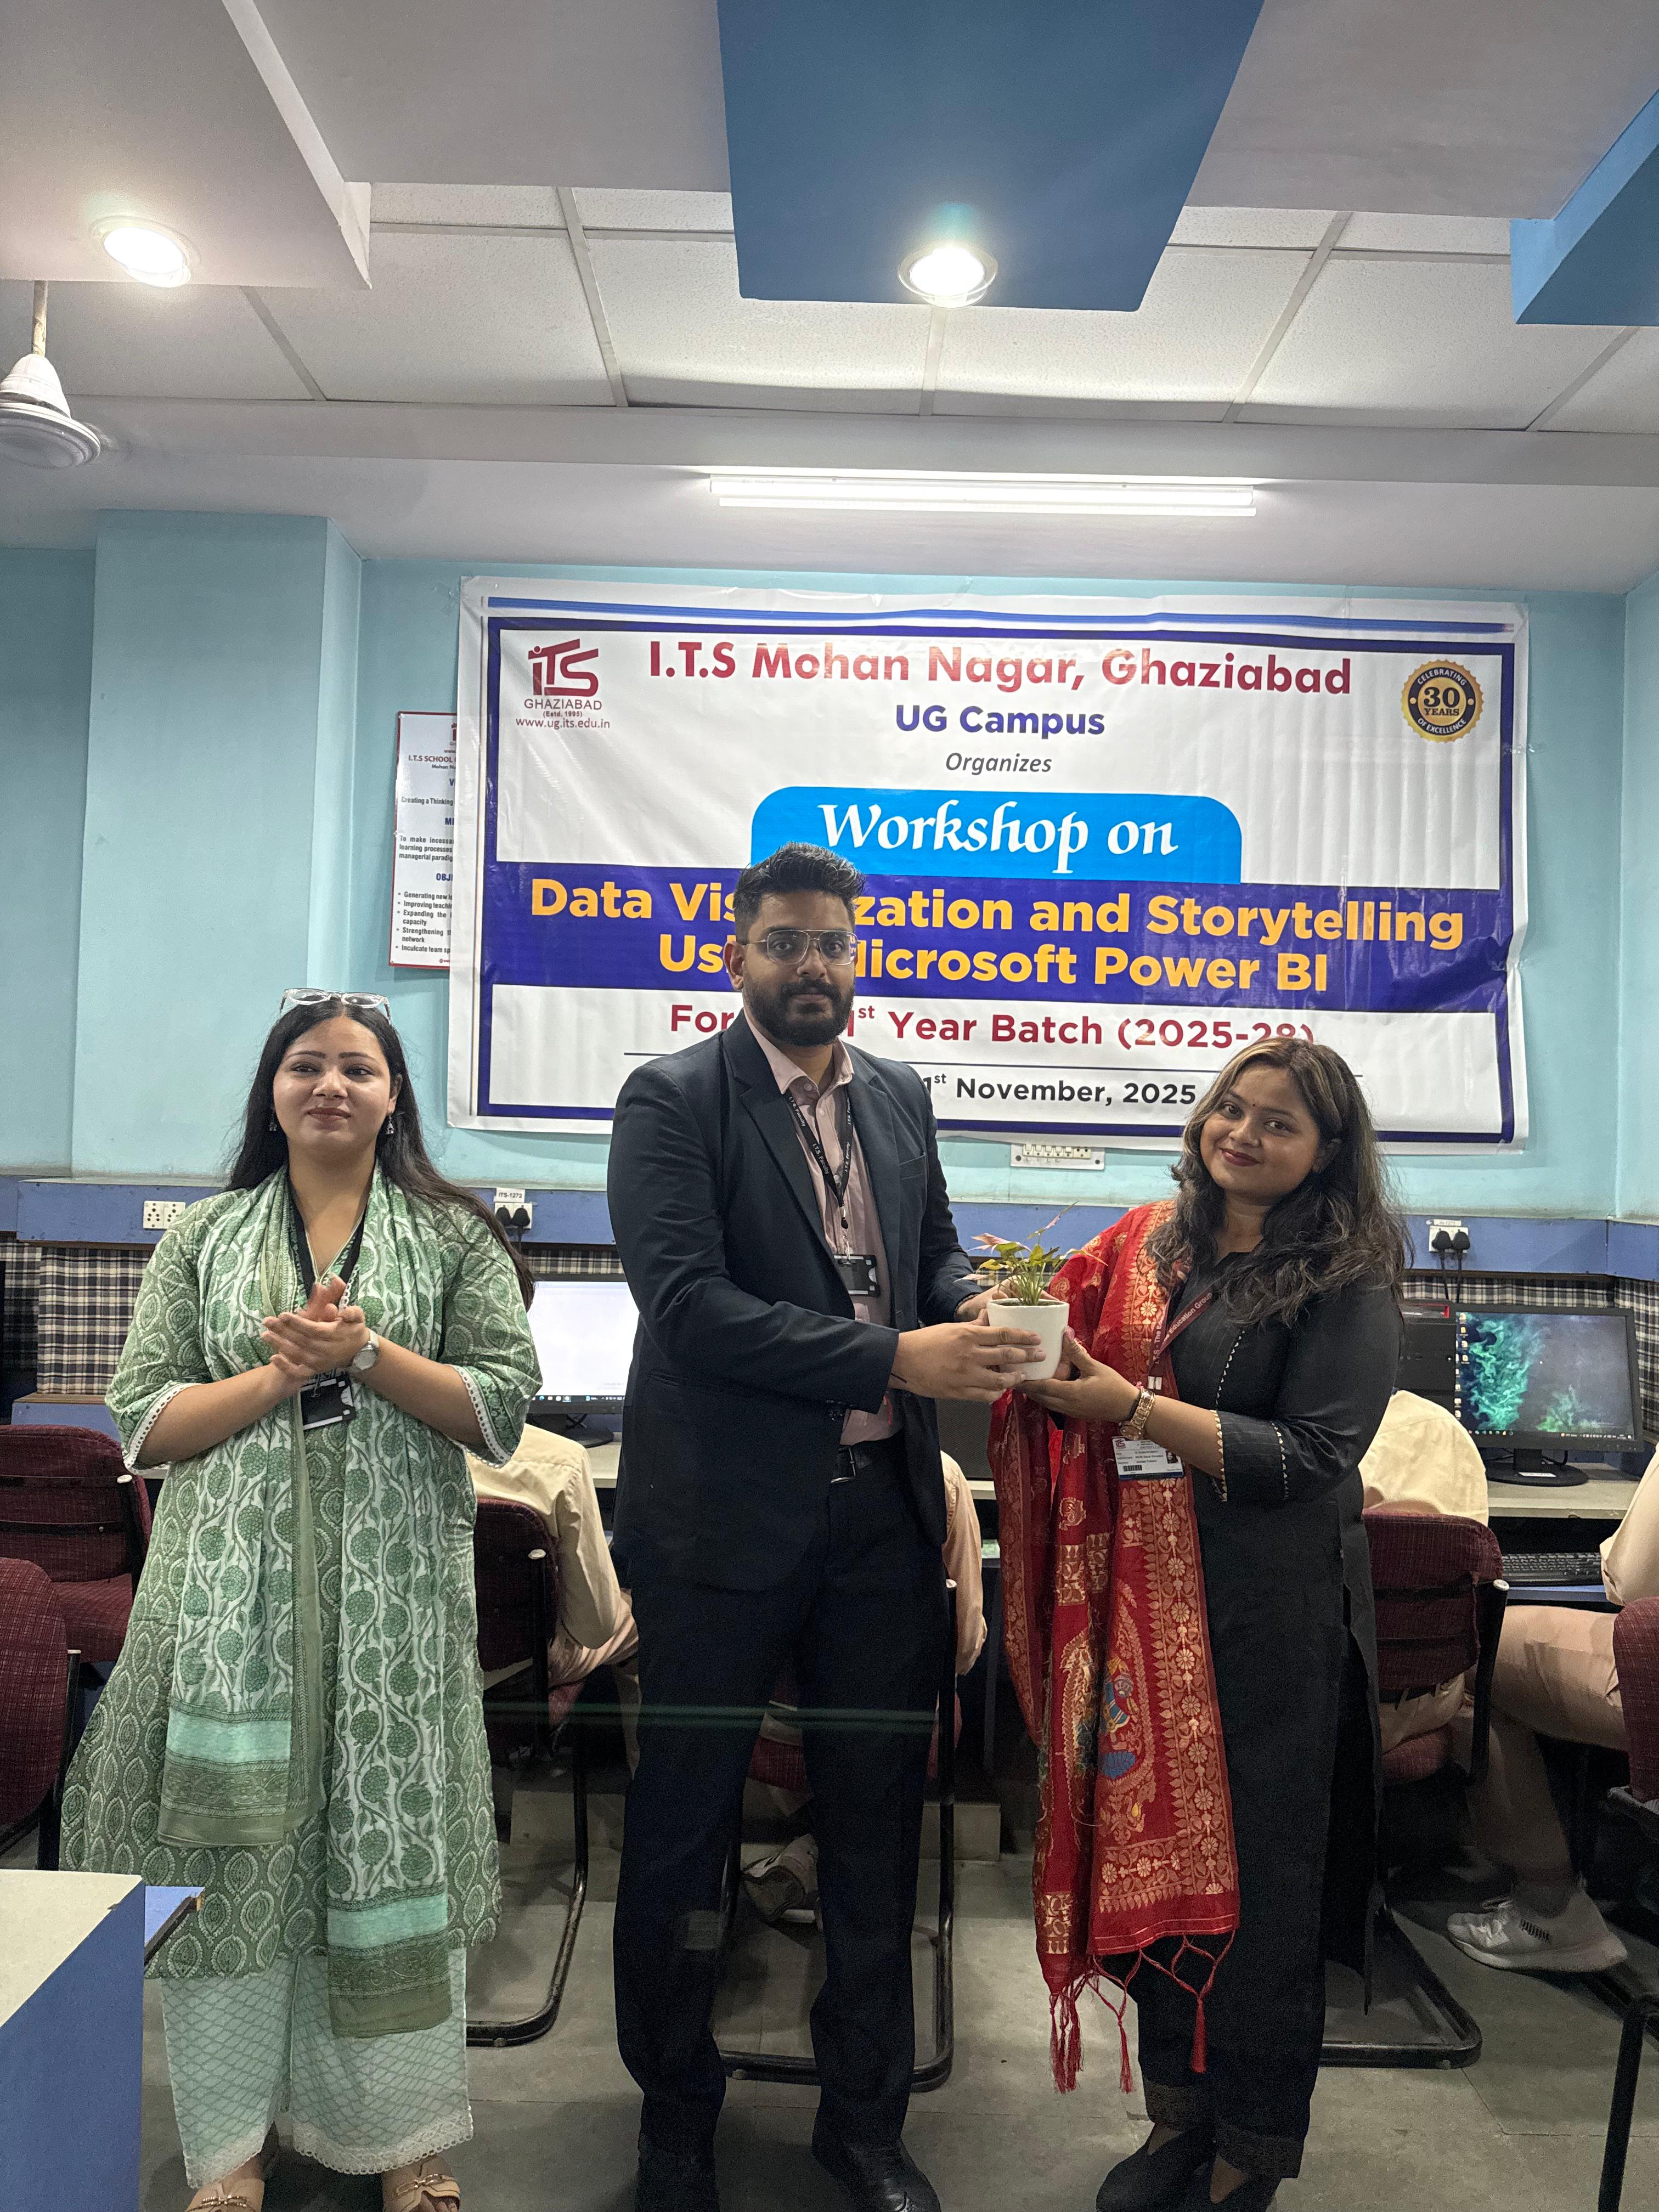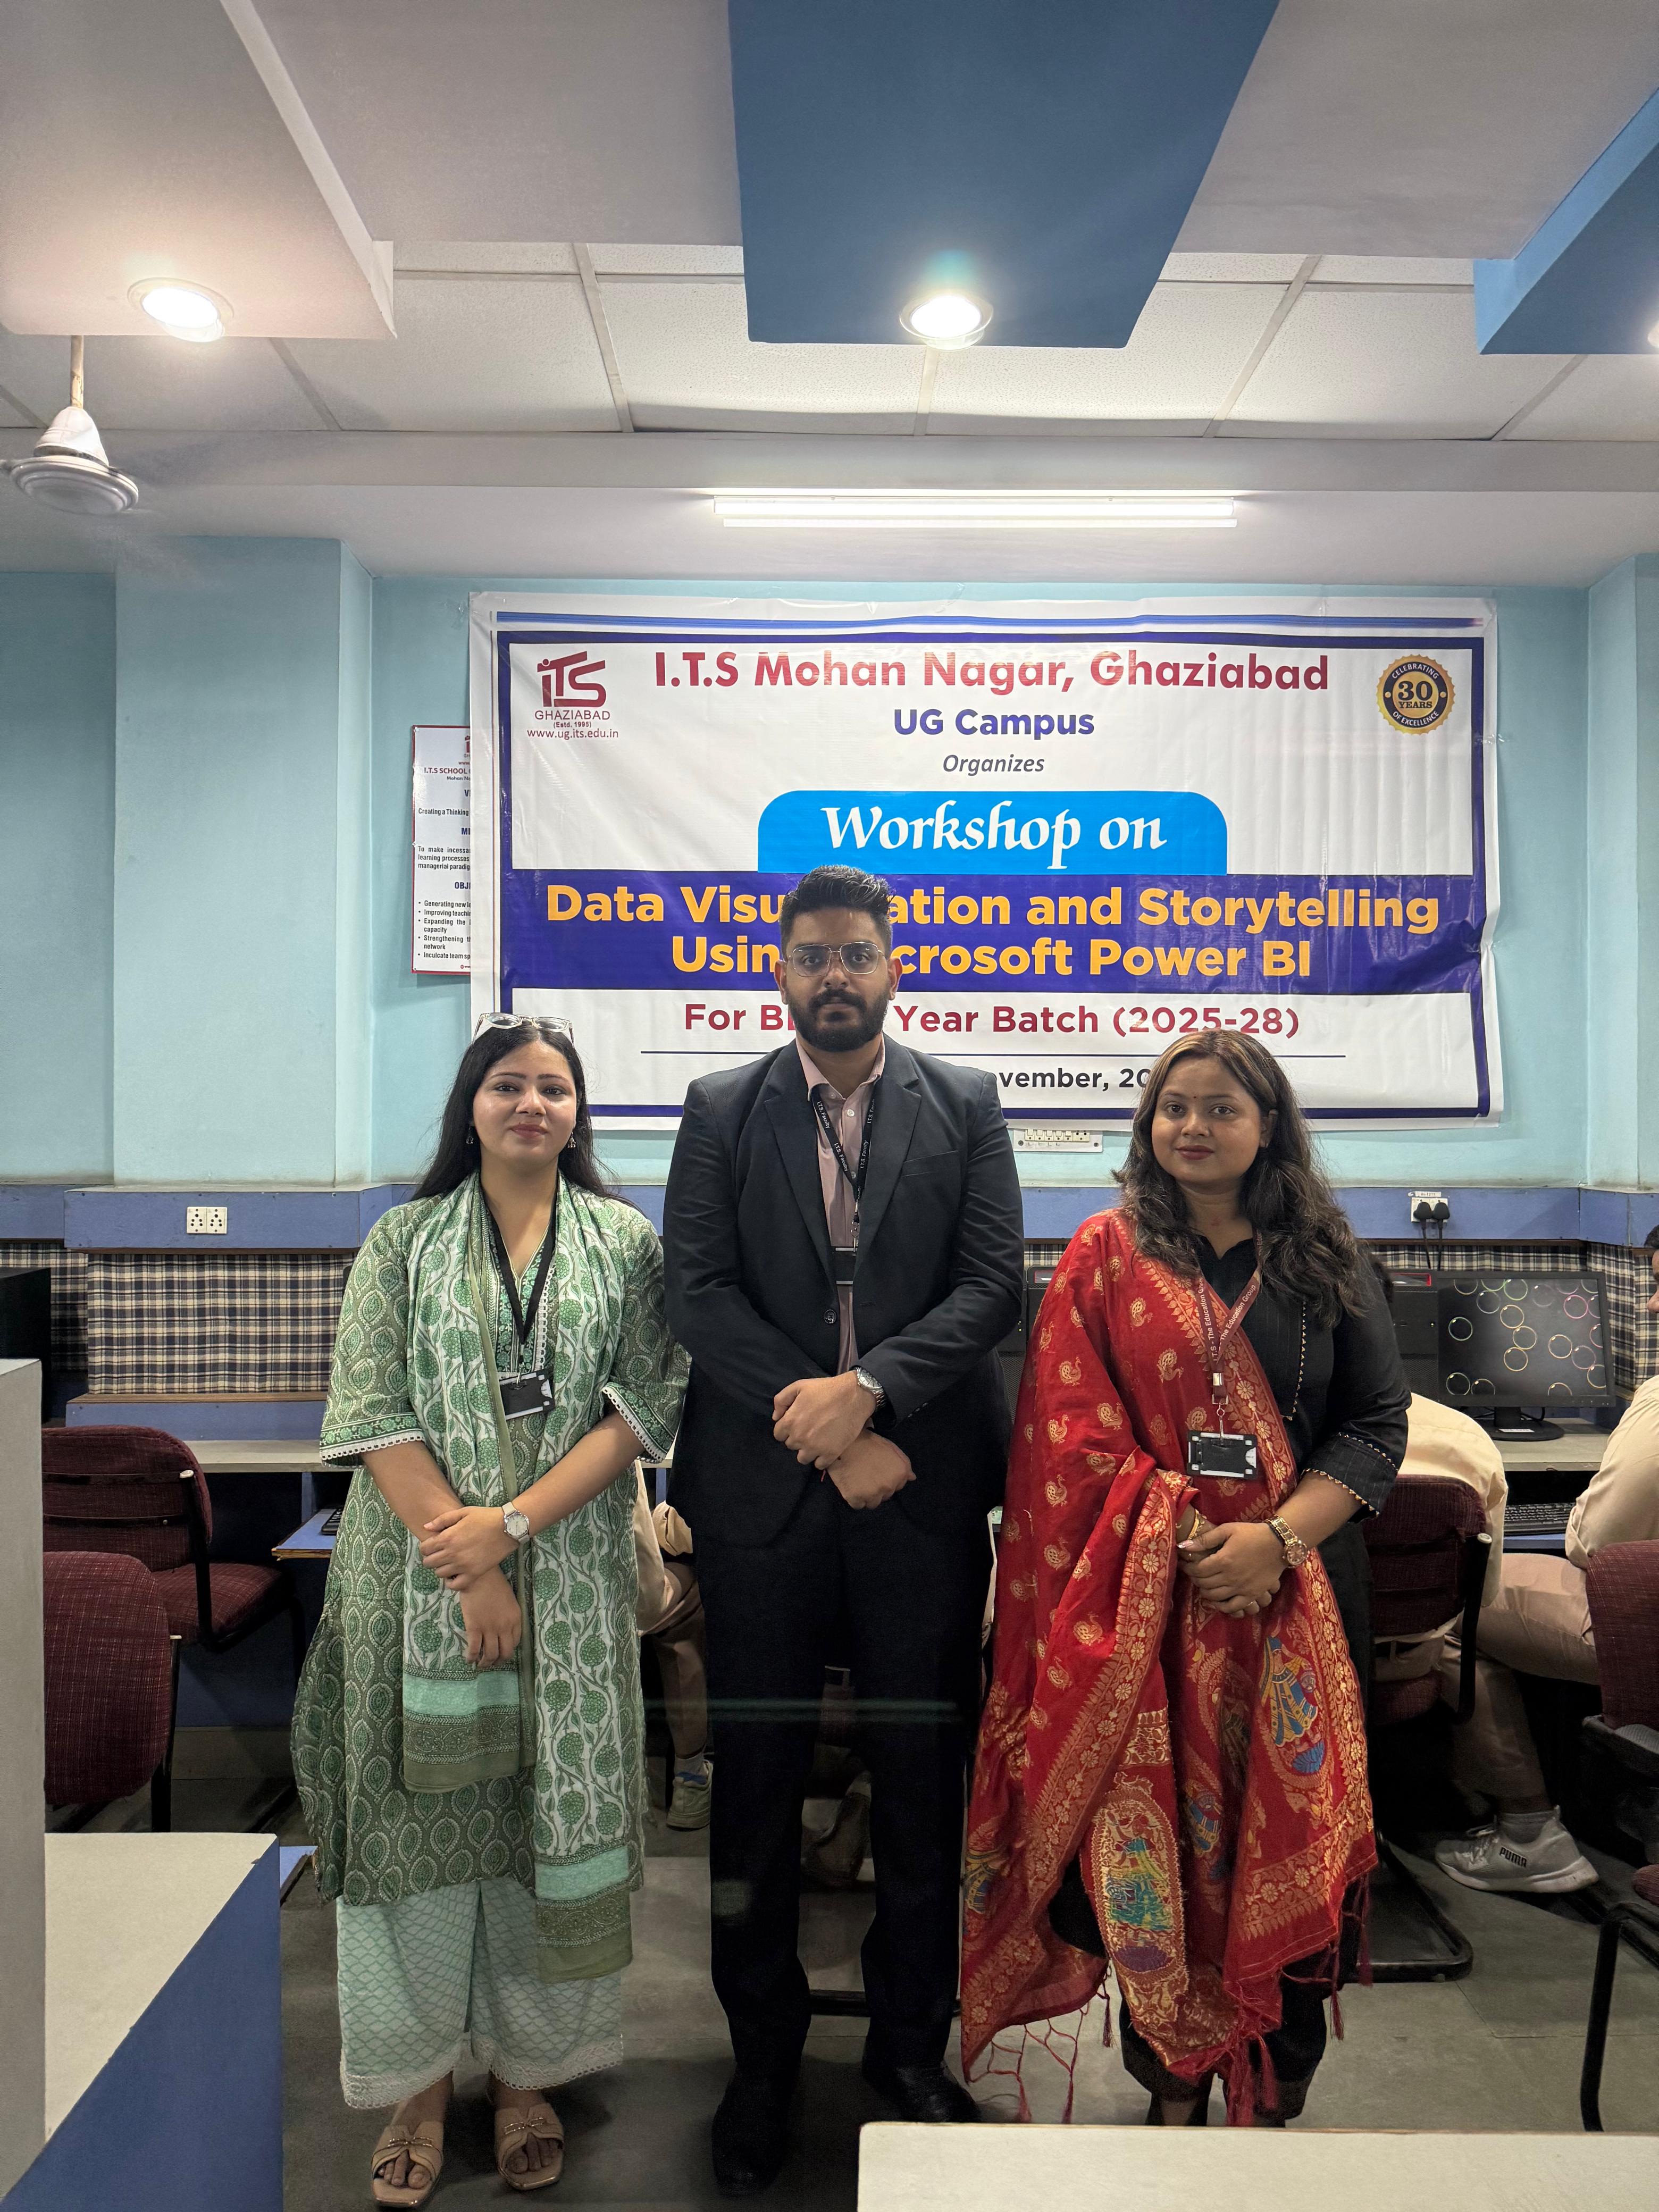


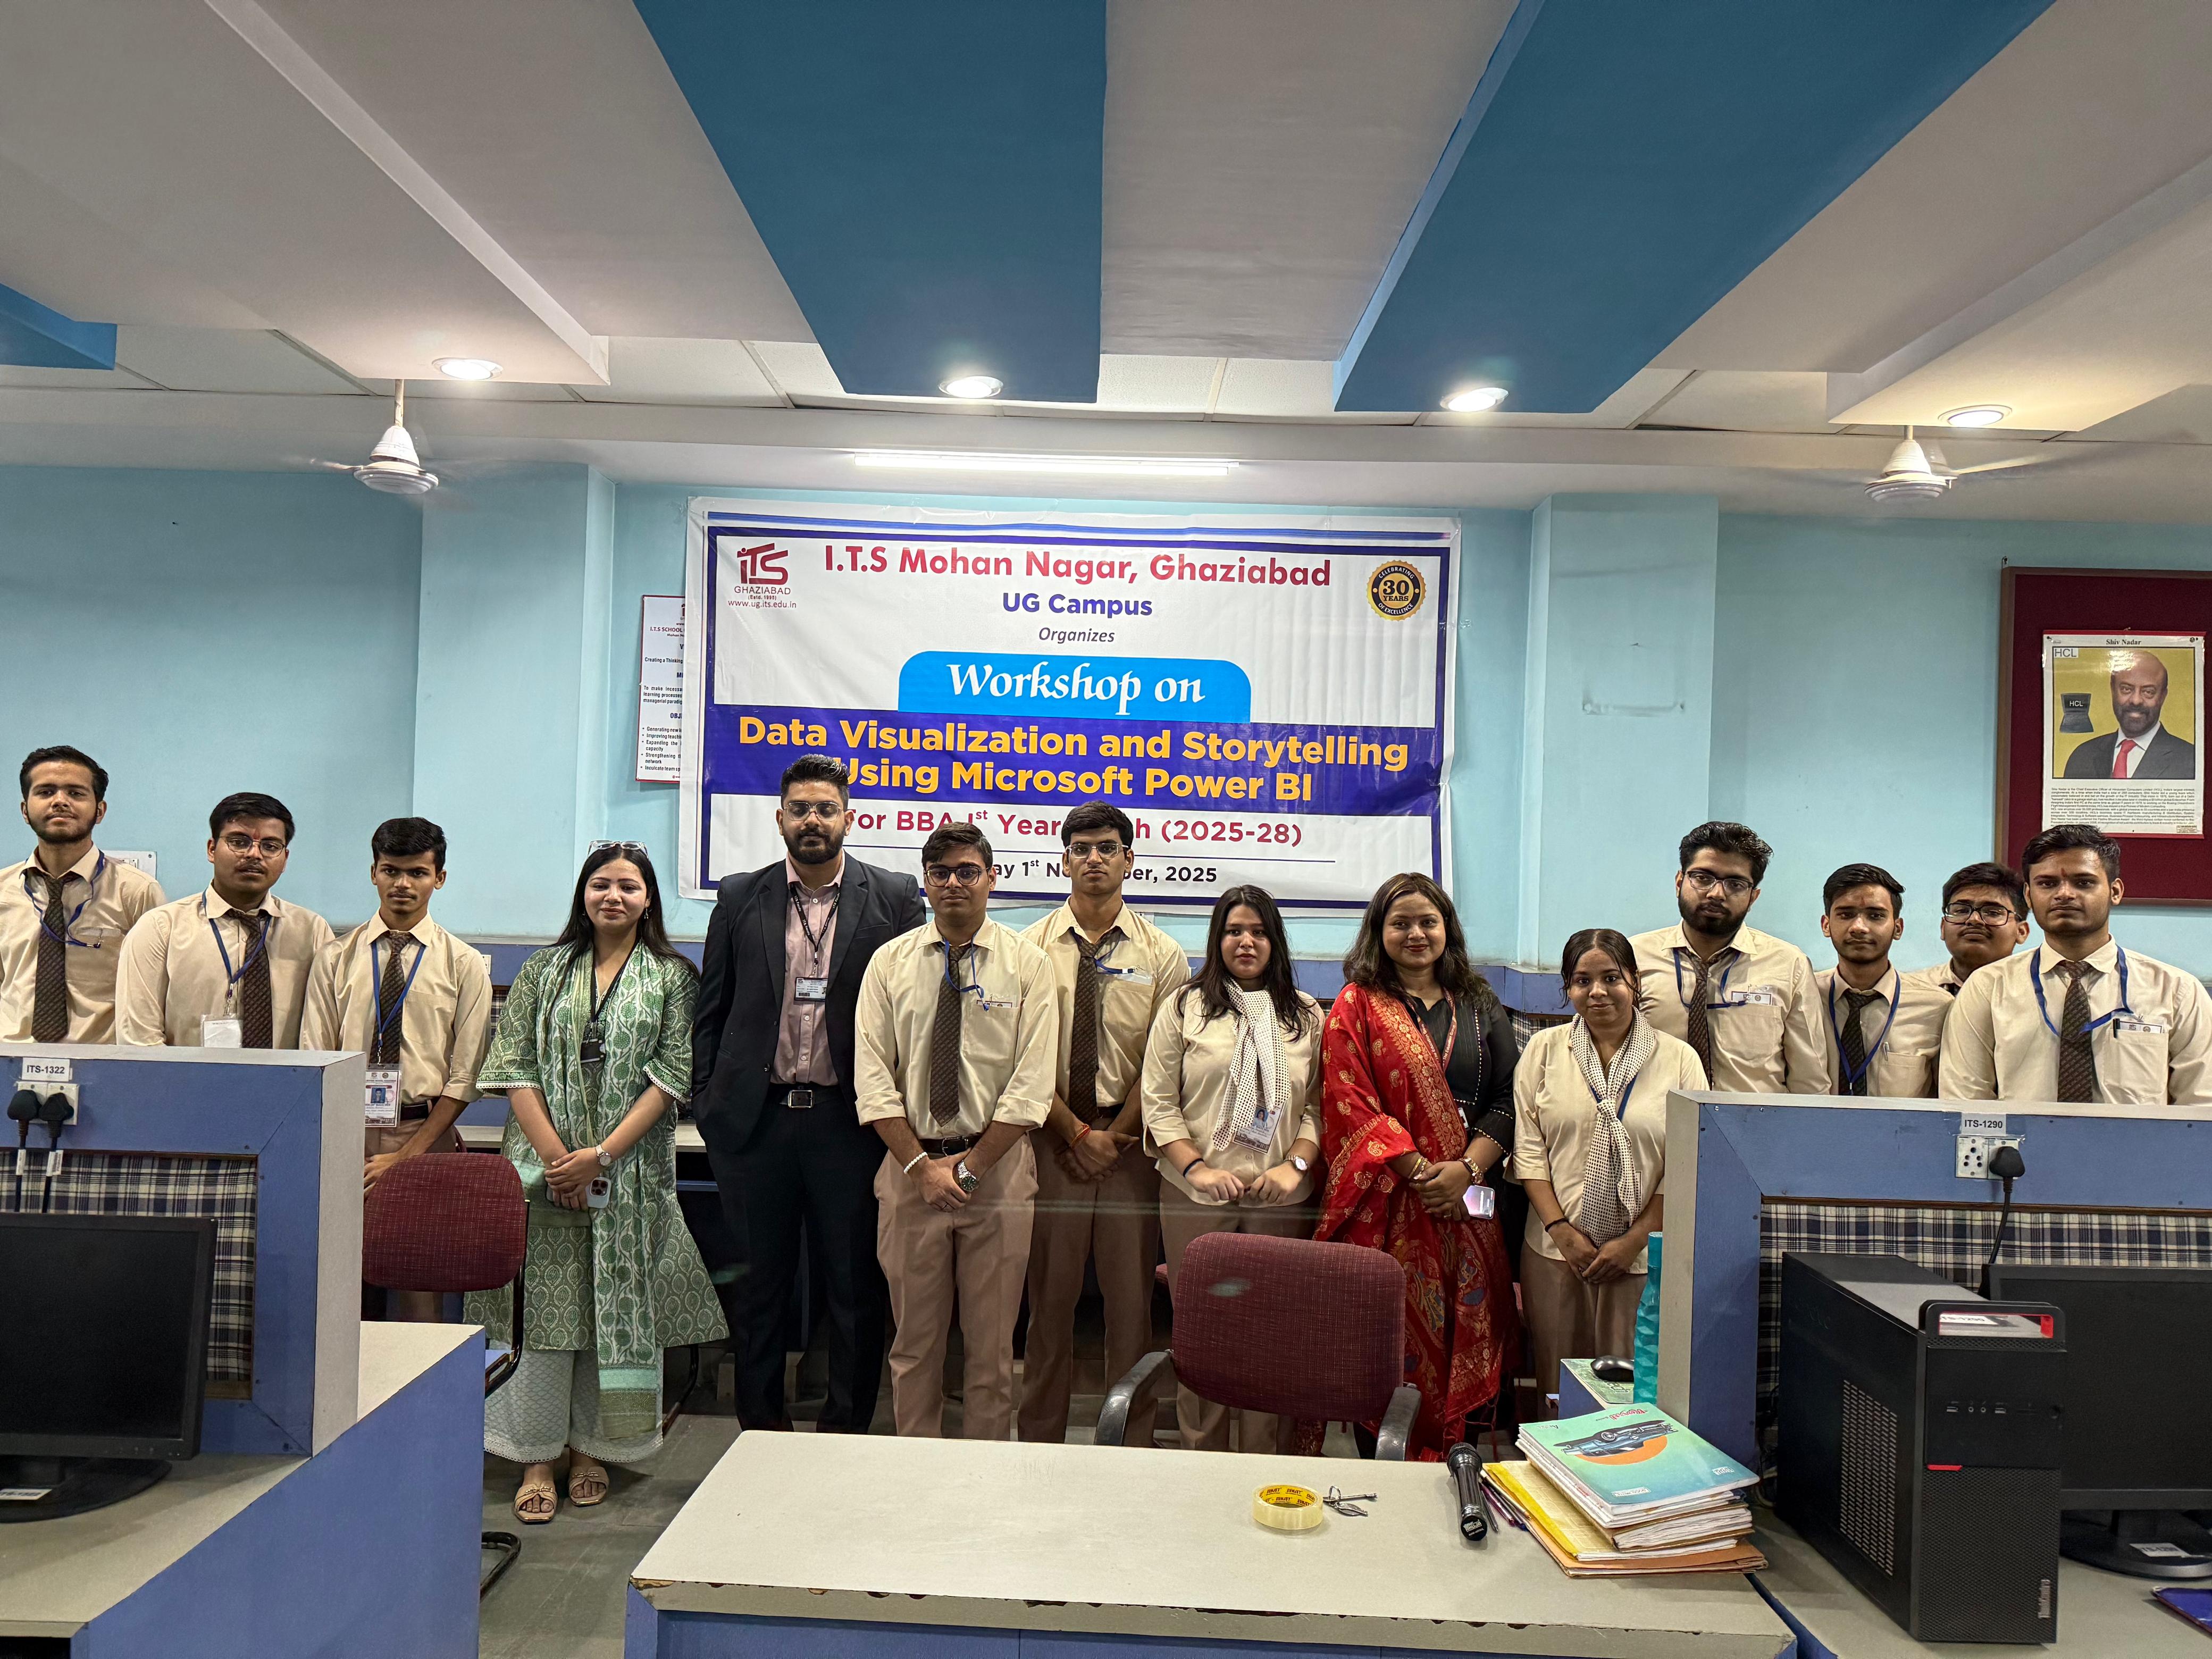
I.T.S Mohan Nagar UG Campus successfully organized a Workshop on “Data Visualization and Storytelling using Power BI” for BBA Batch 2025–2028 students on 1st November, 2025 (Saturday).
01-11-2025Description: The Workshop on Data Visualization and Storytelling using Power BI for BBA Batch 2025–2028 aimed to enhance students’ understanding of data analytics, visualization techniques, and the art of presenting insights effectively through Power BI. The session focused on enabling students to translate complex data into meaningful visual narratives for better decision-making and strategic communication. Participants learned to create interactive dashboards, develop insightful reports, and convey data- driven stories using visualization principles. The workshop emphasized the role of storytelling in business analytics, helping students grasp how visual representation of data can influence interpretation and action in corporate environments. The workshop was designed to improve students’ analytical thinking, technical proficiency, and communication skills. It encouraged them to explore the power of data in shaping business strategies and decision-making processes. Students actively engaged in hands-on activities, demonstrating enthusiasm and curiosity in applying Power BI tools to real-world data scenarios. This initiative significantly enhanced students’ analytical and visualization capabilities, promoted data-driven thinking, and motivated them to leverage technology for effective business communication and reporting. The event proved to be a valuable learning experience, strengthening students’ practical knowledge of business analytics tools and fostering confidence in using modern data visualization techniques for professional growth.
.jpeg)